can uti
resource
ar
larly di
WHAT’S IN A (USER) NAME
Oct '15 3.86% 11,411 998 3,928 2,580 5,281 465 321 934 2,877 * 71 *
Market Pulse™ data representsalllistings t k
As social networking websites and blogs continue
to gain popularity in the real estate marketing world,
real estate professionals are striving to create unique and
clever usernames that identify them publicly to others
viewing the site. “Number1realtor” or “yourorlandorealtor”
or “jane_orlando_realtor” may sound like unique usernames,
but each of these examples violates the National Association of
REALTORS® trademark usage rules as well as the bylaws of the Orlando
Regional REALTOR® Association.
The rules governing the use of the REALTOR® marks are the same
regardless of the medium in which the marks are being used, i.e., print advertising,
web advertising, URLs, e-mail addresses, usernames, and more.
These rules require the REALTOR® marks to be used with the name of a
member or with the legal name of a member broker’s real estate business.
A separate rule prohibits use of REALTOR® with descriptive words or phrases.
Because domain names must be lowercase and cannot accommodate
the R symbol, the requirements to use capitalization and the registration
symbol “®” with the REALTOR® marks are relaxed for usernames. Here
are some examples of acceptable and unacceptable usernames:
��Acceptable usernames ��Unacceptable usernames
janesmithrealtor realtor
jsmithrealtor orlandorealtor
smithrealtor yourorlandorealtor
jane_smith_realtor your_orlando_realtor
realtorjanesmith cyberrealtor
realtorjsmith virtualrealtor
realtorsmith realtor_mom
realtor_smith realtorsolution
jane_the_realtor top_orlando_realtor
jane_a_realtor number1realtor
realtorjaneorlando hotshotrealtor
orlandojanerealtor residentialrealtor
Here are additional ideas for putting ORRA’s free
housing stats resource to work on your behalf:
1. Build anticipation for your blog (or vlog)
by crafting a weekly interpretation of the
Monday Morning Quarterback Report.
2. Post the infographic on Facebook, and link
it back to your website.
3. Broadcast a live Facebook feed from one of
your listings and explain how current stats
support market conditions that make it a
good time to buy (or sell) a home.
4. Tweet a single stat plus a simple explanation
on a schedule that fits your routine.
Your followers will come to expect these
tidbits.
5. Embed the video into your e-mail newsletter,
or have it be the subject of an e-mail
blast.
6. Create your own chart in Excel using data
from the reports, and post it on Instagram
or Facebook. Link the chart back to your
website or blog for more detail.
7. Pin the infographic to your Pinterest board.
Add it to your homepage for a captivating
mix of color and information that will keep
visitors on your side.
8. Post the video on your website.
9. Study the narrative for a firm grasp on how
to explain to consumers where the market
is now compared to where it was a year
ago.
10. Print out color copies of the consumer
friendly charts and graphs in Market
Pulse to provide at listing presentations.
ORRA’s housing market stats resources,
including archives, are located under the
“Research” tab on orlandorealtors.org. Tip: The
“Current Month” page under “Research” either
directly houses or links to all of the most current
resources and information.
of data reports – that you can utilize in your own
marketing efforts, for FREE!
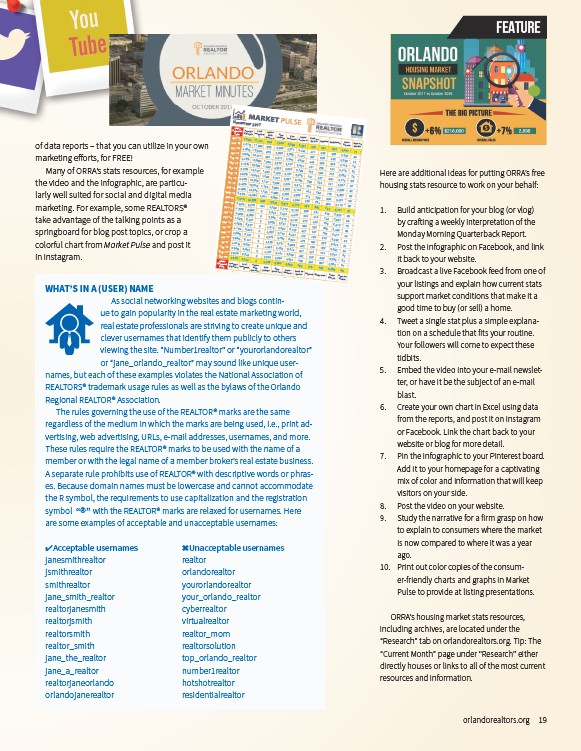
Many of ORRA’s stats resources, for example
the video and the infographic, are particularly
well suited for social and digital media
marketing. For example, some R
REALTORS®
take advantage of the talking points as a
springboard for blog post topics, or crop a
colorful chart from Market Pulse and post it
in Instagram.
ORRA
Originated
Sales
Average
Mtg Rate
Total
Inventory
**
Active
With
Contract
New
Listings
New
Contracts
Under
Contract
Back on
Market Expired Withdrawn
Nov '15 4.01% 11,300 905 3,388 2,271 5,182 471 285 856 2,325 * 68 *
Dec '15 4.02% 10,634 819 2,939 2,006 4,472 397 529 802 2,639 * 72 *
Jan '16 3.93% 10,777 901 3,814 2,540 4,932 449 308 829 2,146 * 76 *
Feb '16 3.75% 10,696 1,054 3,918 2,747 5,424 461 256 744 2,415 * 82 *
Mar '16 3.70% 10,583 1,100 4,353 3,033 5,798 480 280 773 3,058 * 70 *
Apr '16 3.63% 10,447 1,203 4,450 3,157 6,075 441 237 804 3,172 * 69 *
May '16 3.62% 10,553 1,265 4,347 2,957 6,169 505 233 741 3,347 * 67 *
Jun '16 3.45% 10,629 1,147 4,208 2,684 5,512 381 272 726 3,556 * 62 *
Jul '16 3.45% 10,648 1,166 3,965 2,535 5,178 424 258 779 3,353 * 60 *
Aug '16 3.49% 10,505 1,120 4,090 2,555 4,955 412 260 903 3,451 * 56 *
Sept '16 3.53% 10,362 1,047 3,695 2,179 4,594 360 284 850 3,110 * 60 *
Oct '16 3.57% 10,025 629 3,245 2,271 4,719 368 286 754 2,701 * 61 *
Nov '16 3.82% 9,270 164 3,198 2,713 5,122 369 261 818 2,523 * 66 *
Dec '16 4.32% 8,590 0 2,623 2,223 4,476 378 418 708 2,997 * 65 *
Jan '17 4.30% 8,550 0 3,580 3,015 5,145 372 240 709 2,213 * 70 *
Feb '17 4.29% 8,457 0 3,830 3,281 5,849 380 232 639 2,482 * 69 *
Mar '17 4.29% 8,537 0 4,612 3,687 6,125 421 181 758 3,477 * 64 *
Apr '17 4.11% 8,675 0 4,333 3,713 6,461 472 159 612 3,092 * 63 *
May '17 4.09% 8,781 0 4,670 3,750 6,524 475 190 806 3,845 * 54 *
Jun '17 3.98% 9,141 0 4,629 3,421 5,886 482 219 702 3,882 * 54 *
Jul '17 4.01% 9,051 0 4,080 3,460 5,819 521 221 774 3,381 * 52 *
Aug '17 3.92% 8,833 0 4,107 3,431 5,666 492 248 826 3,580 * 54 *
Sept '17 3.84% 8,643 0 2,534 2,098 4,881 409 268 597 2,552 * 57 *
Oct '17 4.03% 8,464 0 3,499 2,604 4,953 394 175 750 2,898 56
ORRA
Originated
Sales
Average
Mtg Rate
Total
Inventory
**
Active
With
Contract
New
Listings
New
Contracts
Under
Contract
Back on
Market Expired Withdrawn
Sales
Closed
Days on
Market
Sales
Closed
Days on
Market
whichincludest
November 2017
* Corrected monthly sales. ** No longer includes listings with a status of "Active with Contract."
Complete stats and data may be found under Market Info at www.orlandorealtors.org. Commentsor su
Statistician.
FEATURE
orlandorealtors.org 19