Single Family
Homes
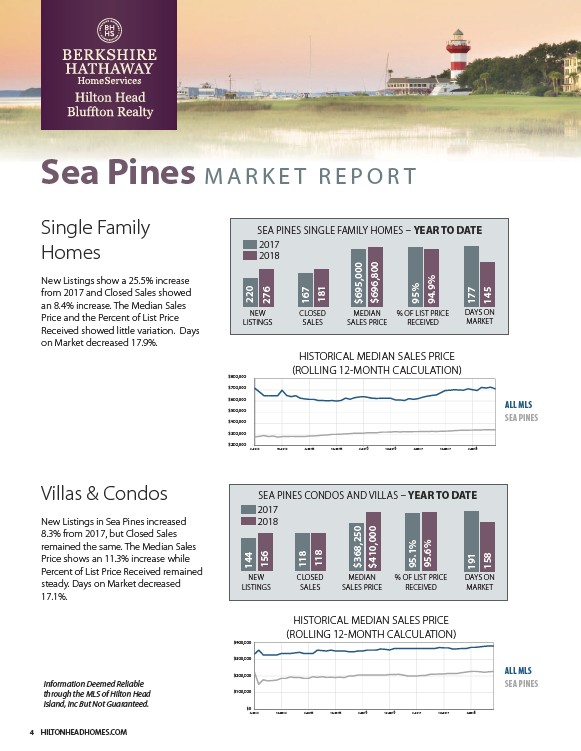
New Listings show a 25.5% increase
from 2017 and Closed Sales showed
an 8.4% increase. The Median Sales
Price and the Percent of List Price
Received showed little variation. Days
on Market decreased 17.9%.
Villas & Condos
New Listings in Sea Pines increased
8.3% from 2017, but Closed Sales
remained the same. The Median Sales
Price shows an 11.3% increase while
Percent of List Price Received remained
steady. Days on Market decreased
17.1%.
Information Deemed Reliable
through the MLS of Hilton Head
Island, Inc But Not Guaranteed.
4 HILTONHEADHOMES.COM
SEA PINES SINGLE FAMILY HOMES YEAR TO DATE
NEW
LISTINGS
CLOSED
SALES
MEDIAN
SALES PRICE
% OF LIST PRICE
RECEIVED
DAYS ON
MARKET
220
$695,000
$696,800
95%
94.9%
177
145
2017
2018
276
167
181
HISTORICAL MEDIAN SALES PRICE
ROLLING 12MONTH CALCULATION
ALL MLS
SEA PINES
$800,000
$700,000
$600,000
$500,000
$400,000
$300,000
,000
,000
,000
,000
,000
,000
$200,000 ,000
4-2014 10-2014 4-2015 10-2015 4-2016 10-2016 4-2017 10-2017 4-2018
SEA PINES CONDOS AND VILLAS YEAR TO DATE
118
118
CLOSED
SALES
$368,250
$410,000
MEDIAN
SALES PRICE
95.1%
95.6%
% OF LIST PRICE
RECEIVED
HISTORICAL MEDIAN SALES PRICE
ROLLING 12MONTH CALCULATION
144
2017
2018
156
NEW
LISTINGS
$400,000
,000
$300,000
,000
$200,000
,000
$100,000
,000
$0$0
191
158
DAYS ON
MARKET
4-2014 10-2014 4-2015 10-2015 4-2016 10-2016 4-2017 10-2017 4-2018
ALL MLS
SEA PINES
Sea Pines MARKET REPOR T
/HILTONHEADHOMES.COM