Single Family
Homes
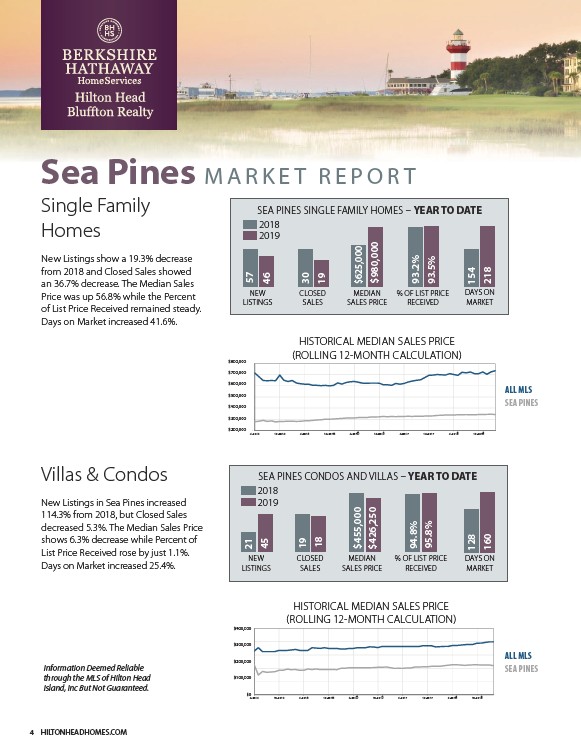
New Listings show a 19.3% decrease
from 2018 and Closed Sales showed
an 36.7% decrease. The Median Sales
Price was up 56.8% while the Percent
of List Price Received remained steady.
Days on Market increased 41.6%.
Villas & Condos
New Listings in Sea Pines increased
114.3% from 2018, but Closed Sales
decreased 5.3%. The Median Sales Price
shows 6.3% decrease while Percent of
List Price Received rose by just 1.1%.
Days on Market increased 25.4%.
Information Deemed Reliable
through the MLS of Hilton Head
Island, Inc But Not Guaranteed.
4 HILTONHEADHOMES.COM
SEA PINES SINGLE FAMILY HOMES YEAR TO DATE
NEW
LISTINGS
CLOSED
SALES
MEDIAN
SALES PRICE
% OF LIST PRICE
RECEIVED
DAYS ON
MARKET
57
$625,000
$980,000
93.2%
93.5%
154
218
2018
2019
46
30
19
HISTORICAL MEDIAN SALES PRICE
ROLLING 12MONTH CALCULATION
ALL MLS
SEA PINES
$800,000
$700,000
$600,000
$500,000
$400,000
$300,000
,000
,000
,000
,000
,000
,000
$200,000 ,000
4-2014 10-2014 4-2015 10-2015 4-2016 10-2016 4-2017 10-2017 4-2018 10-2018
SEA PINES CONDOS AND VILLAS YEAR TO DATE
19
18
CLOSED
SALES
$455,000
$426,250
MEDIAN
SALES PRICE
94.8%
95.8%
% OF LIST PRICE
RECEIVED
HISTORICAL MEDIAN SALES PRICE
ROLLING 12MONTH CALCULATION
21
2018
2019
45
NEW
LISTINGS
$400,000
,000
,000
$300,000
,000
$200,000
,000
$100,000
,000
$0$0
128
160
DAYS ON
MARKET
4-2014 10-2014 4-2015 10-2015 4-2016 10-2016 4-2017 10-2017 4-2018 10-2018
ALL MLS
SEA PINES
Sea Pines MARKET REPOR T
/HILTONHEADHOMES.COM