Folly Field, Burkes/Seaside, Chaplin,
Singleton & Bradley Beach MARKET REPOR T
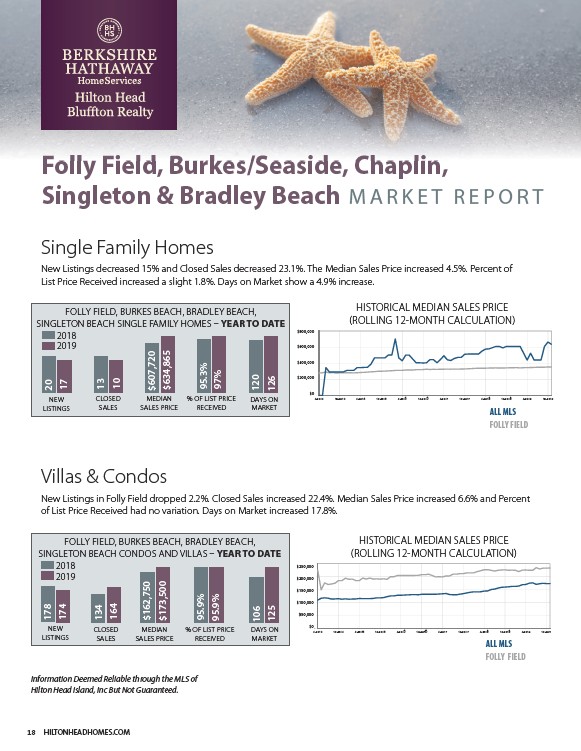
Single Family Homes
New Listings decreased 15% and Closed Sales decreased 23.1%. The Median Sales Price increased 4.5%. Percent of
List Price Received increased a slight 1.8%. Days on Market show a 4.9% increase.
HISTORICAL MEDIAN SALES PRICE
ROLLING 12MONTH CALCULATION
00,000
00,000
00,000
00,000
FOLLY FIELD, BURKES BEACH, BRADLEY BEACH,
SINGLETON BEACH SINGLE FAMILY HOMES YEAR TO DATE
Villas & Condos
New Listings in Folly Field dropped 2.2%. Closed Sales increased 22.4%. Median Sales Price increased 6.6% and Percent
of List Price Received had no variation. Days on Market increased 17.8%.
FOLLY FIELD, BURKES BEACH, BRADLEY BEACH,
SINGLETON BEACH CONDOS AND VILLAS YEAR TO DATE
18 HILTONHEADHOMES.COM
HISTORICAL MEDIAN SALES PRICE
ROLLING 12MONTH CALCULATION
50,000
$250,000
00,000
$200,000
$150,000
50,000
$100,000
00,000
$50,000
50,000
$0$0
4-2014 10-2014 4-2015 10-2015 4-2016 10-2016 4-2017 10-2017 4-2018 10-2018 4-2019 10-2019
ALL MLS
FOLLY FIELD
NEW
LISTINGS
CLOSED
SALES
MEDIAN
SALES PRICE
% OF LIST PRICE
RECEIVED
DAYS ON
MARKET
2018
2019
$162,750
$173,500
95.9%
95.9%
106
125
134
164
178
174
ALL MLS
FOLLY FIELD
$0
4-2014 10-2014 4-2015 10-2015 4-2016 10-2016 4-2017 10-2017 4-2018 10-2018 4-2019 10-2019
$800,000
$600,000
$400,000
$200,000
$0
NEW
LISTINGS
CLOSED
SALES
MEDIAN
SALES PRICE
% OF LIST PRICE
RECEIVED
2018
2019
DAYS ON
MARKET
$607,720
$634,865
95.3%
97%
120
126
20
17
13
10
Information Deemed Reliable through the MLS of
Hilton Head Island, Inc But Not Guaranteed.
/HILTONHEADHOMES.COM