2017 Florida Population Update
REAL ESTATE IS SPACE FOR PEOPLE TO LIVE IN, WORK IN,
SHOP IN, AND STORE THINGS IN. MORE PEOPLE MEANS
MORE DEMAND FOR REAL ESTATE.
Populations trends are very positive for Florida, the I-4 corridor, and Polk County. Our firm is positioned
in the center of this expanding population and we understand the opportunities it creates for commercial real
estate sellers and investors.
Florida’s strong population growth is positive for the real estate market because … more people means more
demand for real estate. As a result of our continued population growth, we can expect continued strong demand
for real estate in Florida.
In 2017 Florida’s strong population growth continued. In 2016, population growth was more than 1,000
people per day, which moderated slightly to almost 900 people per day in 2017.
Some highlights of Florida population trends in 2017 include:
• Annual population growth of 327,811 representing a growth rate of 1.59%
• Florida is 6.4% of the US population and 14.2% of the nation’s growth in population
• Florida’s population growth rate is 2.2 times the US population growth rate
• For the third year in a row, Florida is growing by more people than California
Gary M. Ralston is a broker with Coldwell Banker Commercial Saunders Ralston Dantzler Realty.
He can be reached at Gary@SRDcommercial.com or 863-877-2828.
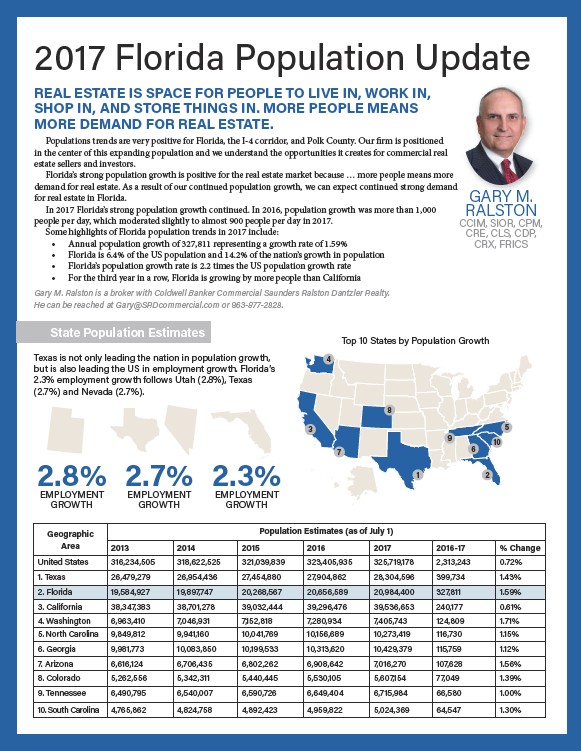
State Population Estimates
Texas is not only leading the nation in population growth,
but is also leading the US in employment growth. Florida’s
2.3% employment growth follows Utah (2.8%), Texas
(2.7%) and Nevada (2.7%).
2.8% 2.7% 2.3%
EMPLOYMENT
GROWTH
Geographic
Area
GARY M.
RALSTON
CCIM, SIOR, CPM,
CRE, CLS, CDP,
CRX, FRICS
Top 10 States by Population Growth
8
9
7 6
3
4
EMPLOYMENT
GROWTH
Population Estimates (as of July 1)
10
5
1
2
EMPLOYMENT
GROWTH
2013 2014 2015 2016 2017 2016-17 % Change
United States 316,234,505 318,622,525 321,039,839 323,405,935 325,719,178 2,313,243 0.72%
1. Texas 26,479,279 26,954,436 27,454,880 27,904,862 28,304,596 399,734 1.43%
2. Florida 19,584,927 19,897,747 20,268,567 20,656,589 20,984,400 327,811 1.59%
3. California 38,347,383 38,701,278 39,032,444 39,296,476 39,536,653 240,177 0.61%
4. Washington 6,963,410 7,046,931 7,152,818 7,280,934 7,405,743 124,809 1.71%
5. North Carolina 9,849,812 9,941,160 10,041,769 10,156,689 10,273,419 116,730 1.15%
6. Georgia 9,981,773 10,083,850 10,199,533 10,313,620 10,429,379 115,759 1.12%
7. Arizona 6,616,124 6,706,435 6,802,262 6,908,642 7,016,270 107,628 1.56%
8. Colorado 5,262,556 5,342,311 5,440,445 5,530,105 5,607,154 77,049 1.39%
9. Tennessee 6,490,795 6,540,007 6,590,726 6,649,404 6,715,984 66,580 1.00%
10 . South Carolina 4,765,862 4,824,758 4,892,423 4,959,822 5,024,369 64,547 1.30%
link