STATS SHOTS
Total
$5M and above
$1M - $4.9M
$500,000 - $999,999
$250,000 - $499,999
$100,000 - $249,999
$50,000 - $99,000
49,999 and below
49,999 and
below
$50,000 -
$99,000
$100,000 -
$249,999
$250,000 -
$499,999
$500,000 -
$999,999 $1M - $4.9M $5M and
above Total
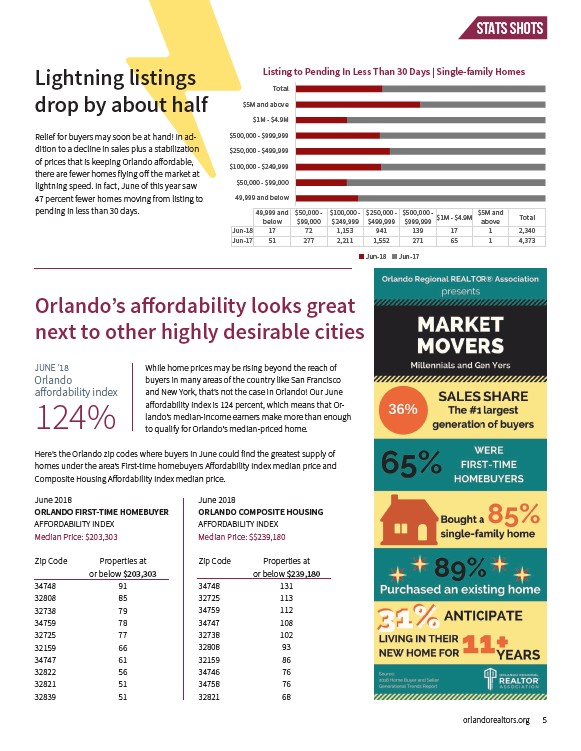
Jun-18 17 72 1,153 941 139 17 1 2,340
Jun-17 51 277 2,211 1,552 271 65 1 4,373
Jun-18 Jun-17
Lightning listings
drop by about half
Orlando’s affordability looks great
next to other highly desirable cities
While home prices may be rising beyond the reach of
buyers in many areas of the country like San Francisco
and New York, that’s not the case in Orlando! Our June
affordability index is 124 percent, which means that Orlando’s
to qualify for Orlando’s median-priced home.
JUNE '18
Orlando
affordability index
Here’s the Orlando zip codes where buyers in June could find the greatest supply of
homes under the area’s First-time homebuyers Affordability Index median price and
Composite Housing Affordability Index median price.
June 2018
ORLANDO FIRST-TIME HOMEBUYER
AFFORDABILITY INDEX
Median Price: $203,303
Zip Code Properties at
or below $203,303
34748 91
32808 85
32738 79
34759 78
32725 77
32159 66
34747 61
32822 56
32821 51
32839 51
median-income earners make more than enough
June 2018
ORLANDO COMPOSITE HOUSING
AFFORDABILITY INDEX
Median Price: $$239,180
Zip Code Properties at
or below $239,180
34748 131
32725 113
34759 112
34747 108
32738 102
32808 93
32159 86
34746 76
34758 76
32821 68
124%
Listing to Pending In Less Than 30 Days | Single-family Homes
Relief for buyers may soon be at hand! In addition
to a decline in sales plus a stabilization
of prices that is keeping Orlando affordable,
there are fewer homes flying off the market at
lightning speed. In fact, June of this year saw
47 percent fewer homes moving from listing to
pending in less than 30 days.
orlandorealtors.org 5
/orlandorealtors.org