Folly Field, Burkes/Seaside, Chaplin,
Singleton & Bradley Beach MARKET REPOR T
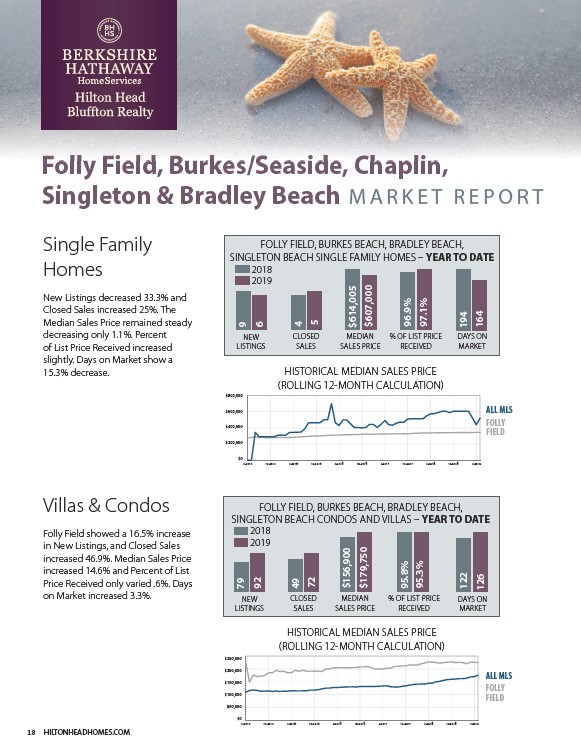
Single Family
Homes
New Listings decreased 33.3% and
Closed Sales increased 25%. The
Median Sales Price remained steady
decreasing only 1.1%. Percent
of List Price Received increased
slightly. Days on Market show a
15.3% decrease.
Villas & Condos
Folly Field showed a 16.5% increase
in New Listings, and Closed Sales
increased 46.9%. Median Sales Price
increased 14.6% and Percent of List
Price Received only varied .6%. Days
on Market increased 3.3%.
18 HILTONHEADHOMES.COM
FOLLY FIELD, BURKES BEACH, BRADLEY BEACH,
SINGLETON BEACH SINGLE FAMILY HOMES YEAR TO DATE
NEW
LISTINGS
CLOSED
SALES
MEDIAN
SALES PRICE
% OF LIST PRICE
RECEIVED
2018
2019
HISTORICAL MEDIAN SALES PRICE
ROLLING 12MONTH CALCULATION
DAYS ON
MARKET
ALL MLS
FOLLY
FIELD
4-2014 10-2014 4-2015 10-2015 4-2016 10-2016 4-2017 10-2017 4-2018 10-2018 4-2019
FOLLY FIELD, BURKES BEACH, BRADLEY BEACH,
$800,000
00,000
$600,000
00,000
$400,000
00,000
$200,000
00,000
$0
$0
SINGLETON BEACH CONDOS AND VILLAS YEAR TO DATE
NEW
LISTINGS
CLOSED
SALES
MEDIAN
SALES PRICE
% OF LIST PRICE
RECEIVED
DAYS ON
MARKET
2018
2019
HISTORICAL MEDIAN SALES PRICE
ROLLING 12MONTH CALCULATION
50,000
$250,000
00,000
$200,000
$150,000
50,000
$100,000
00,000
$50,000
50,000
$0$0
4-2014 10-2014 4-2015 10-2015 4-2016 10-2016 4-2017 10-2017 4-2018 10-2018 4-2019
ALL MLS
FOLLY
FIELD
$614,005
$607,000
$156,900
$179,750
96.9%
97.1%
95.8%
95.3%
194
164
122
126
4
5
49
72
9
6
79
92
/HILTONHEADHOMES.COM