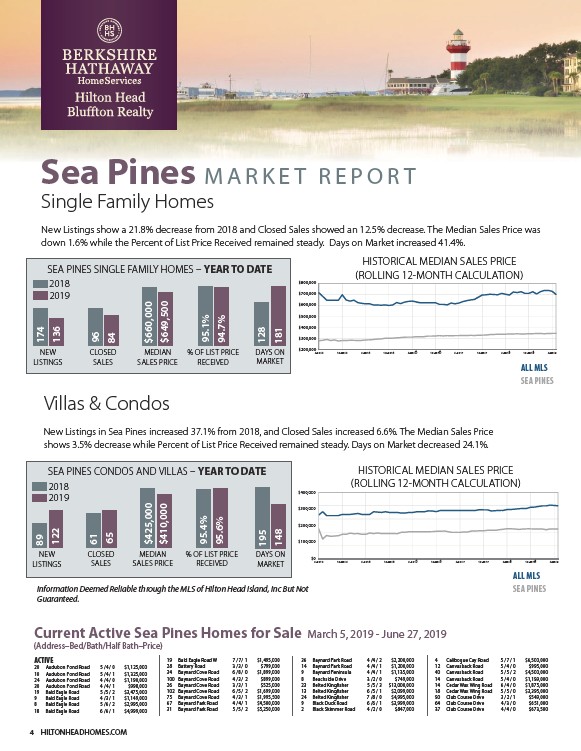
Single Family Homes
New Listings show a 21.8% decrease from 2018 and Closed Sales showed an 12.5% decrease. The Median Sales Price was
down 1.6% while the Percent of List Price Received remained steady. Days on Market increased 41.4%.
SEA PINES SINGLE FAMILY HOMES YEAR TO DATE
$800,000
$700,000
$600,000
$500,000
$400,000
$300,000
$200,000
Information Deemed Reliable through the MLS of Hilton Head Island, Inc But Not
Guaranteed.
,000
,000
,000
,000
,000
,000
,000
,000
,000
,000
,000
HISTORICAL MEDIAN SALES PRICE
ROLLING 12MONTH CALCULATION
Current Active Sea Pines Homes for Sale March 5, 2019 - June 27, 2019
(Address–Bed/Bath/Half Bath–Price)
ACTIVE
20 Audubon Pond Road 5 /4 / 0 $1,125,000
10 Audubon Pond Road 5 /4 / 1 $1,325,000
24 Audubon Pond Road 4 /4 / 0 $1,190,000
30 Audubon Pond Road 4 /4 / 1 $998,000
19 Bald Eagle Road 5 /5 / 2 $3,475,000
9 Bald Eagle Road 4 /3 / 1 $1,149,000
8 Bald Eagle Road 5 /6 / 2 $2,995,000
18 Bald Eagle Road 6 /6 / 1 $4,999,000
4 HILTONHEADHOMES.COM
19 Bald Eagle Road W 7 /7 / 1 $1,495,000
28 Battery Road 3 /3 / 0 $799,000
34 Baynard Cove Road 6 /8 / 0 $1,899,000
100 Baynard Cove Road 4 /3 / 2 $899,000
26 Baynard Cove Road 3 /3 / 1 $525,000
102 Baynard Cove Road 6 /5 / 2 $1,699,000
75 Baynard Cove Road 4 /3 / 1 $1,995,500
67 Baynard Park Road 4 /4 / 1 $4,500,000
31 Baynard Park Road 5 /5 / 2 $5,250,000
36 Baynard Park Road 4 /4 / 2 $2,200,000
14 Baynard Park Road 4 /4 / 1 $1,200,000
9 Baynard Peninsula 4 /4 / 1 $1,135,000
8 Beachside Drive 3 /2 / 0 $749,000
23 Belted Kingfisher 5 /5 / 3 $13,000,000
13 Belted Kingfisher 6 /5 / 1 $2,099,000
24 Belted Kingfisher 7 /8 / 0 $4,995,000
9 Black Duck Road 6 /6 / 1 $3,999,000
2 Black Skimmer Road 4 /2 / 0 $847,000
4 Calibogue Cay Road 5 /7 / 1 $6,500,000
12 Canvasback Road 5 /4 / 0 $995,000
40 Canvasback Road 5 /5 / 2 $4,500,000
14 Canvasback Road 5 /4 / 0 $1,199,000
14 Cedar Wax Wing Road 6 /4 / 0 $1,875,000
18 Cedar Wax Wing Road 5 /5 / 0 $3,395,000
90 Club Course Drive 3 /2 / 1 $549,000
64 Club Course Drive 4 /3 / 0 $651,000
37 Club Course Drive 4 /4 / 0 $673,500
NEW
LISTINGS
CLOSED
SALES
MEDIAN
SALES PRICE
% OF LIST PRICE
RECEIVED
DAYS ON
MARKET
174
$660,000
$649,500
95.1%
94.7%
128
181
2018
2019
136
96
84
NEW
LISTINGS
CLOSED
SALES
MEDIAN
SALES PRICE
% OF LIST PRICE
RECEIVED
DAYS ON
MARKET
89
$425,000
$410,000
95.4%
95.6%
195
148
2018
2019
122
61
65
HISTORICAL MEDIAN SALES PRICE
ROLLING 12MONTH CALCULATION
$400,000
$300,000
$200,000
$100,000
$0$0
4-2014 10-2014 4-2015 10-2015 4-2016 10-2016 4-2017 10-2017 4-2018 10-2018 4-2019
ALL MLS
SEA PINES
Sea Pines MARKET REPOR T
Villas & Condos
New Listings in Sea Pines increased 37.1% from 2018, and Closed Sales increased 6.6%. The Median Sales Price
shows 3.5% decrease while Percent of List Price Received remained steady. Days on Market decreased 24.1%.
ALL MLS
SEA PINES
,000
4-2014 10-2014 4-2015 10-2015 4-2016 10-2016 4-2017 10-2017 4-2018 10-2018 4-2019
SEA PINES CONDOS AND VILLAS YEAR TO DATE
/HILTONHEADHOMES.COM