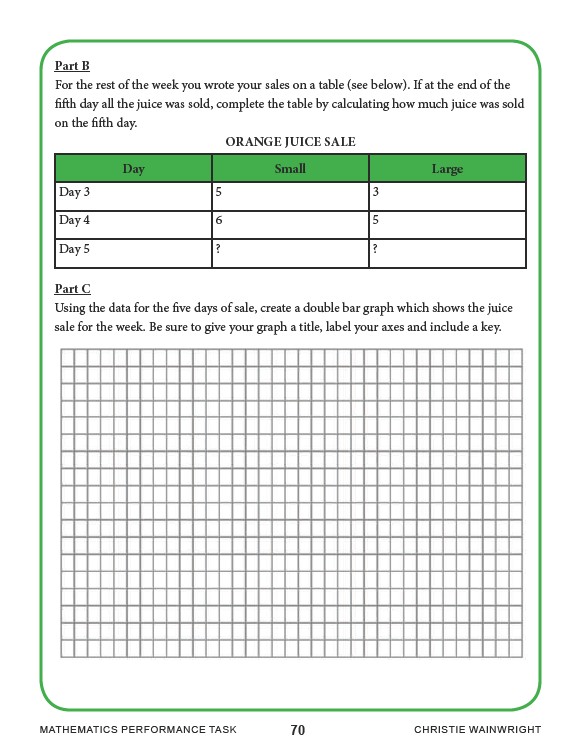
Part B
For the rest of the week you wrote your sales on a table (see below). If at the end of the
fifth day all the juice was sold, complete the table by calculating how much juice was sold
on the fifth day.
ORANGE JUICE SALE
Day Small Large
Day 3 5 3
Day 4 6 5
Day 5 ? ?
Part C
Using the data for the five days of sale, create a double bar graph which shows the juice
sale for the week. Be sure to give your graph a title, label your axes and include a key.
MATHEMATICS PERFORMANCE TASK 70 CHRISTIE WAINWRIGHT