STATS SHOTS
2017 Cumulative Comparison
Underwater Mortgages
The number of seriously underwater mortgages
(125 loan-to-value) in the Orlando
MSA declined 6 percent in the third quarter
of 2017, compared to the same quarter in 2016. Currently
9.2 percent of all Orlando mortgages are seriously underwater,
which mirrors nation’s 9.3 percent.
SERIOUSLY UNDERWATER MORTGAGES
SNOWBALL
EFFECT
Orlando's wintertime homebuyers got the best
deals in 2017, when the third quarter per-squarefoot
price was four percent below the
annual average of $126.19.
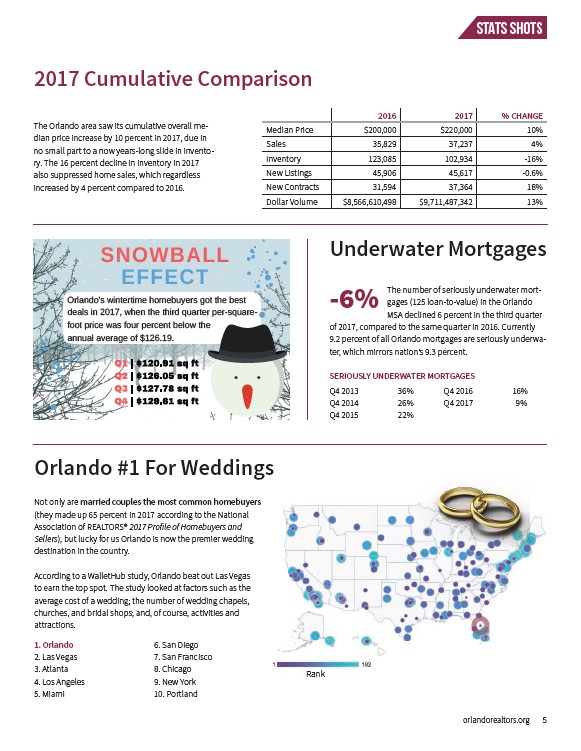
Orlando #1 For Weddings
Not only are married couples the most common homebuyers
(they made up 65 percent in 2017 according to the National
Association of REALTORS® 2017 Profile of Homebuyers and
Sellers), but lucky for us Orlando is now the premier wedding
destination in the country.
According to a WalletHub study, Orlando beat out Las Vegas
to earn the top spot. The study looked at factors such as the
average cost of a wedding; the number of wedding chapels,
churches, and bridal shops; and, of course, activities and
attractions.
2016 2017 % CHANGE
Median Price $200,000 $220,000 10%
Sales 35,829 37,237 4%
Inventory 123,085 102,934 -16%
New Listings 45,906 45,617 -0.6%
New Contracts 31,594 37,364 18%
Dollar Volume $8,566,610,498 $9,711,487,342 13%
The Orlando area saw its cumulative overall median
price increase by 10 percent in 2017, due in
no small part to a now years-long slide in inventory.
The 16 percent decline in inventory in 2017
also suppressed home sales, which regardless
increased by 4 percent compared to 2016.
1. Orlando
2. Las Vegas
3. Atlanta
4. Los Angeles
5. Miami
6. San Diego
7. San Francisco
8. Chicago
9. New York
10. Portland
Rank
-6%
Q4 2013 36%
Q4 2014 26%
Q4 2015 22%
Q4 2016 16%
Q4 2017 9%
orlandorealtors.org 5
/orlandorealtors.org