To simplify, availability is the ratio of total time
a system or component is functional (uptime) within
a specified time interval divided by the time interval
(uptime plus downtime).
As established earlier, while this is the most common
metric used within the data center industry to measure
past success, it does not provide a complete picture.
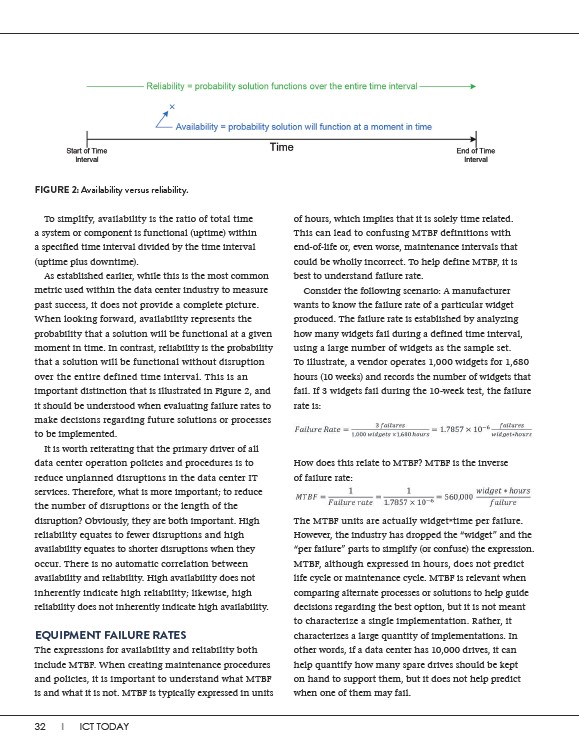
When looking forward, availability represents the
probability that a solution will be functional at a given
moment in time. In contrast, reliability is the probability
that a solution will be functional without disruption
over the entire defined time interval. This is an
important distinction that is illustrated in Figure 2, and
it should be understood when evaluating failure rates to
make decisions regarding future solutions or processes
to be implemented.
It is worth reiterating that the primary driver of all
data center operation policies and procedures is to
reduce unplanned disruptions in the data center IT
services. Therefore, what is more important; to reduce
the number of disruptions or the length of the
disruption? Obviously, they are both important. High
reliability equates to fewer disruptions and high
availability equates to shorter disruptions when they
occur. There is no automatic correlation between
availability and reliability. High availability does not
inherently indicate high reliability; likewise, high
reliability does not inherently indicate high availability.
EQUIPMENT FAILURE RATES
The expressions for availability and reliability both
include MTBF. When creating maintenance procedures
and policies, it is important to understand what MTBF
is and what it is not. MTBF is typically expressed in units
32 I ICT TODAY
of hours, which implies that it is solely time related.
This can lead to confusing MTBF definitions with
end-of-life or, even worse, maintenance intervals that
could be wholly incorrect. To help define MTBF, it is
best to understand failure rate.
Consider the following scenario: A manufacturer
wants to know the failure rate of a particular widget
produced. The failure rate is established by analyzing
how many widgets fail during a defined time interval,
using a large number of widgets as the sample set.
To illustrate, a vendor operates 1,000 widgets for 1,680
hours (10 weeks) and records the number of widgets that
fail. If 3 widgets fail during the 10-week test, the failure
rate is:
How does this relate to MTBF? MTBF is the inverse
of failure rate:
The MTBF units are actually widget*time per failure.
However, the industry has dropped the “widget” and the
“per failure” parts to simplify (or confuse) the expression.
MTBF, although expressed in hours, does not predict
life cycle or maintenance cycle. MTBF is relevant when
comparing alternate processes or solutions to help guide
decisions regarding the best option, but it is not meant
to characterize a single implementation. Rather, it
characterizes a large quantity of implementations. In
other words, if a data center has 10,000 drives, it can
help quantify how many spare drives should be kept
on hand to support them, but it does not help predict
when one of them may fail.
FIGURE 2: Availability versus reliability.