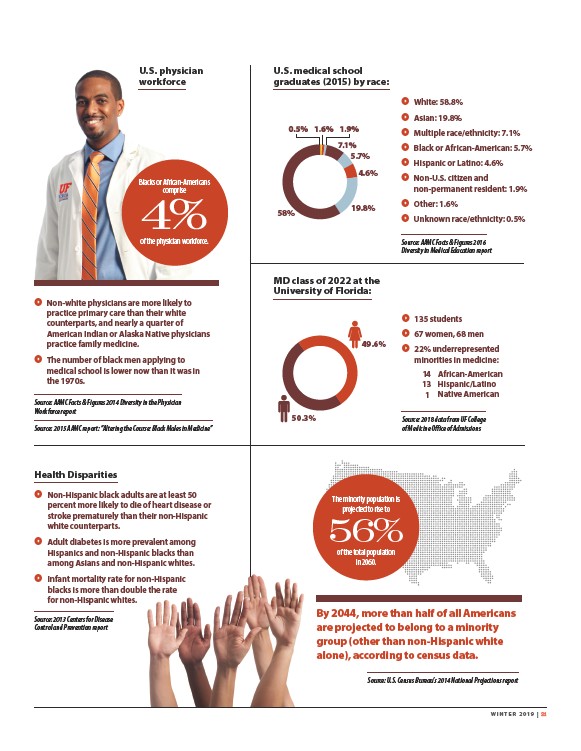
U.S. physician
workforce
Blacks or African-Americans
comprise
of the physician workforce.
› Non-white physicians are more likely to
practice primary care than their white
counterparts, and nearly a quarter of
American Indian or Alaska Native physicians
practice family medicine.
› The number of black men applying to
medical school is lower now than it was in
the 1970s.
Source: AAMC Facts & Figures 2014 Diversity in the Physician
Workforce report
Source: 2015 AAMC report: “Altering the Course: Black Males in Medicine”
U.S. medical school
graduates (2015) by race:
5.7%
19.8%
MD class of 2022 at the
University of Florida:
The minority population is
› White: 58.8%
› Asian: 19.8%
› Multiple race/ethnicity: 7.1%
› Black or African-American: 5.7%
› Hispanic or Latino: 4.6%
› Non-U.S. citizen and
non- permanent resident: 1.9%
› Other: 1.6%
› Unknown race/ethnicity: 0.5%
S
ource: AAMC Facts & Figures 2016
Diversity in Medical Education report
› 135 students
› 67 women, 68 men
› 22% underrepresented
minorities in medicine:
14
13
1
Source: 2018 data from UF College
of Medicine Office of Admissions
projected to rise to
56%
of the total population
in 2060.
African-American
Hispanic/Latino
Native American
By 2044, more than half of all Americans
are projected to belong to a minority
group (other than non-Hispanic white
alone), according to census data.
Source: U.S. Census Bureau’s 2014 National Projections report
58%
4.6%
49.6%
50.3%
Health Disparities
› Non-Hispanic black adults are at least 50
percent more likely to die of heart disease or
stroke prematurely than their non-Hispanic
white counterparts.
› Adult diabetes is more prevalent among
Hispanics and non-Hispanic blacks than
among Asians and non-Hispanic whites.
› Infant mortality rate for non-Hispanic
blacks is more than double the rate
for non-Hispanic whites.
Source: 2013 Centers for Disease
Control and Prevention report
W I N T E R 2019 | 21