Core
0-25 μm
Cladding
25-120 μm
Adhesive
120-130 μm
Contact
130-250 μm
Non-critical
zone 250+ μm
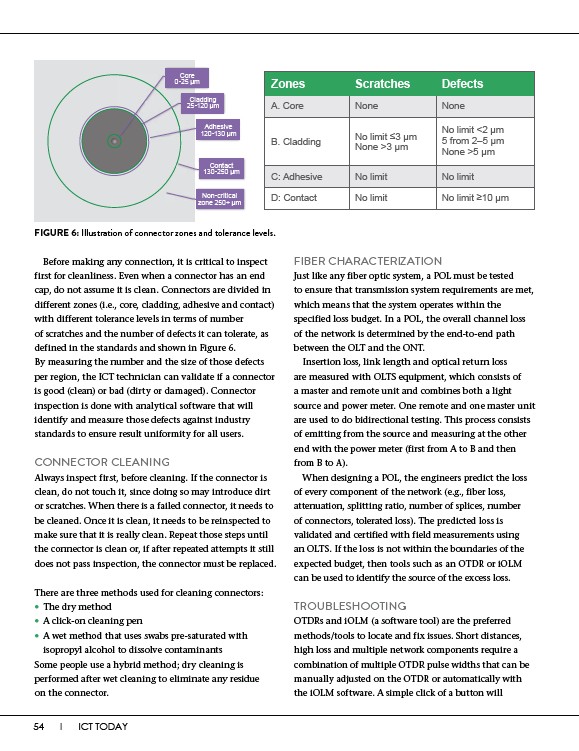
Before making any connection, it is critical to inspect
first for cleanliness. Even when a connector has an end
cap, do not assume it is clean. Connectors are divided in
different zones (i.e., core, cladding, adhesive and contact)
with different tolerance levels in terms of number
of scratches and the number of defects it can tolerate, as
defined in the standards and shown in Figure 6.
By measuring the number and the size of those defects
per region, the ICT technician can validate if a connector
is good (clean) or bad (dirty or damaged). Connector
inspection is done with analytical software that will
identify and measure those defects against industry
standards to ensure result uniformity for all users.
CONNECTOR CLEANING
Always inspect first, before cleaning. If the connector is
clean, do not touch it, since doing so may introduce dirt
or scratches. When there is a failed connector, it needs to
be cleaned. Once it is clean, it needs to be reinspected to
make sure that it is really clean. Repeat those steps until
the connector is clean or, if after repeated attempts it still
does not pass inspection, the connector must be replaced.
There are three methods used for cleaning connectors:
• The dry method
• A click-on cleaning pen
• A wet method that uses swabs pre-saturated with
isopropyl alcohol to dissolve contaminants
Some people use a hybrid method; dry cleaning is
performed after wet cleaning to eliminate any residue
on the connector.
54 I ICT TODAY
Zones Scratches Defects
A. Core None None
B. Cladding No limit ��3 ��m
None >3 ��m
No limit <2 ��m
None >5 ��m
5 from 2–5 ��m
C: Adhesive No limit No limit
D: Contact No limit No limit ��10 ��m
FIGURE 6: Illustration of connector zones and tolerance levels.
FIBER CHARACTERIZATION
Just like any fiber optic system, a POL must be tested
to ensure that transmission system requirements are met,
which means that the system operates within the
specified loss budget. In a POL, the overall channel loss
of the network is determined by the end-to-end path
between the OLT and the ONT.
Insertion loss, link length and optical return loss
are measured with OLTS equipment, which consists of
a master and remote unit and combines both a light
source and power meter. One remote and one master unit
are used to do bidirectional testing. This process consists
of emitting from the source and measuring at the other
end with the power meter (first from A to B and then
from B to A).
When designing a POL, the engineers predict the loss
of every component of the network (e.g., fiber loss,
attenuation, splitting ratio, number of splices, number
of connectors, tolerated loss). The predicted loss is
validated and certified with field measurements using
an OLTS. If the loss is not within the boundaries of the
expected budget, then tools such as an OTDR or iOLM
can be used to identify the source of the excess loss.
TROUBLESHOOTING
OTDRs and iOLM (a software tool) are the preferred
methods/tools to locate and fix issues. Short distances,
high loss and multiple network components require a
combination of multiple OTDR pulse widths that can be
manually adjusted on the OTDR or automatically with
the iOLM software. A simple click of a button will