by theNA look at thUe metrics shMaping the technBology mareket —R and our liSves
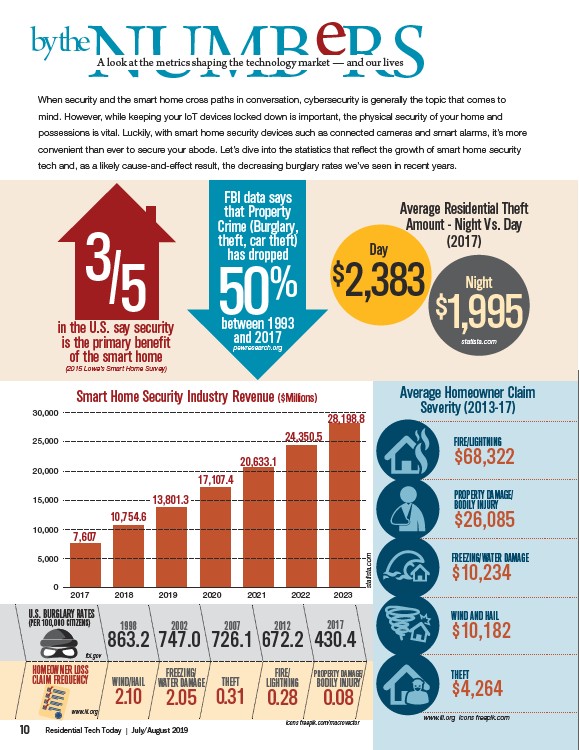
When security and the smart home cross paths in conversation, cybersecurity is generally the topic that comes to
mind. However, while keeping your IoT devices locked down is important, the physical security of your home and
possessions is vital. Luckily, with smart home security devices such as connected cameras and smart alarms, it’s more
convenient than ever to secure your abode. Let’s dive into the statistics that reflect the growth of smart home security
tech and, as a likely cause-and-effect result, the decreasing burglary rates we’ve seen in recent years.
3/5
in the U.S. say security
is the primary benefit
of the smart home
(2015 Lowe’s Smart Home Survey)
Smart Home Security Industry Revenue ($Millions)
7,607
10,754.6
13,801.3
10 Residential Tech Today | July/August 2019
FBI data says
that Property
Crime (Burglary,
theft, car theft)
50%
has dropped
between 1993
and 2017
pewresearch.org
Average Residential Theft
Amount - Night Vs. Day
Day (2017)
$2,383 Night
$1,995
statista.com
30,000
25,000
20,000
15,000
10,000
5,000
0
17,107.4
20,633.1
24,350.5
28,198.8
2017 2018 2019 2020 2021 2022 2023
statista.com
Average Homeowner Claim
Severity (2013-17)
FIRE/LIGHTNING
$68,322
PROPERTY DAMAGE/
BODILY INJURY
$26,085
FREEZING/WATER DAMAGE
$10,234
WIND AND HAIL
$10,182
THEFT
$4,264
www.iii.org icons freepik.com
icons freepik.com/macrovector
U.S. BURGLARY RATES
(PER 100,000 CITIZENS)
HOMEOWNER LOSS
CLAIM FREQUENCY
1998
863.2
2002
747.0
2007
726.1
2012
672.2
2017
430.4
fbi.gov
WIND/HAIL
2.10
FREEZING/
WATER DAMAGE
2.05
THEFT
0.31
FIRE/
LIGHTNING
0.28
PROPERTY DAMAGE/
BODILY INJURY
0.08
www.iii.org
/pewresearch.org
/statista.com
/statista.com
/www.iii.org
/www.iii.org
/freepik.com
/macrovector
/fbi.gov