2018 ORRA ANNUAL REPORT
2018 CUMULATIVE COMPARISON
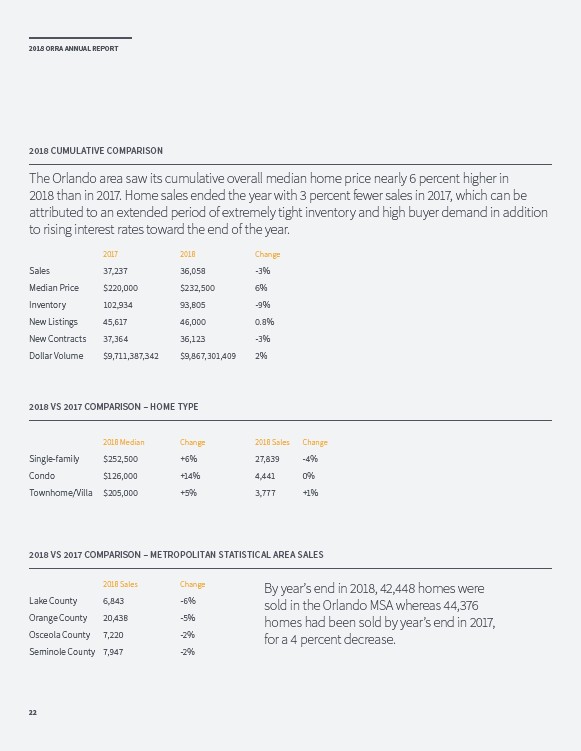
The Orlando area saw its cumulative overall median home price nearly 6 percent higher in
2018 than in 2017. Home sales ended the year with 3 percent fewer sales in 2017, which can be
attributed to an extended period of extremely tight inventory and high buyer demand in addition
to rising interest rates toward the end of the year.
2017 2018 Change
Sales 37,237 36,058 -3%
Median Price $220,000 $232,500 6%
Inventory 102,934 93,805 -9%
New Listings 45,617 46,000 0.8%
New Contracts 37,364 36,123 -3%
Dollar Volume $9,711,387,342 $9,867,301,409 2%
2018 VS 2017 COMPARISON – HOME TYPE
2018 Median Change 2018 Sales Change
Single-family $252,500 +6% 27,839 -4%
Condo $126,000 +14% 4,441 0%
Townhome/Villa $205,000 +5% 3,777 +1%
2018 VS 2017 COMPARISON – METROPOLITAN STATISTICAL AREA SALES
2018 Sales Change
Lake County 6,843 -6%
Orange County 20,438 -5%
Osceola County 7,220 -2%
Seminole County 7,947 -2%
22
By year’s end in 2018, 42,448 homes were
sold in the Orlando MSA whereas 44,376
homes had been sold by year’s end in 2017,
for a 4 percent decrease.