Table 2. RCC histology subtypes within the patient cohort and distribution within treatment groups.
Histology sub-type N (%)
Clear cell Non-clear cell Unclassified/NOS Unknown
Pazopanib 231 (86) 7 (3) 9 (3) 21 (8)
Sunitinib 310 (79) 34 (9) 36 (9) • (4)
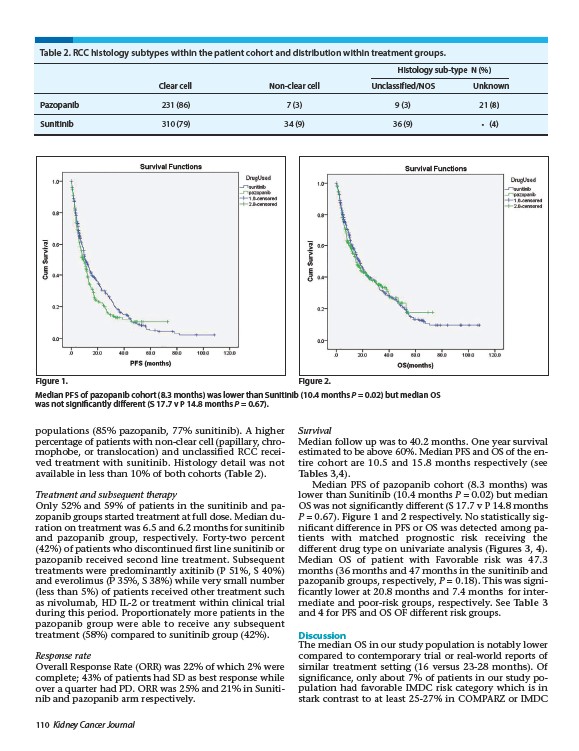
Figure 1. Figure 2.
Median PFS of pazopanib cohort (8.3 months) was lower than Sunitinib (10.4 months P = 0.02) but median OS
was not significantly different (S 17.7 v P 14.8 months P = 0.67).
populations (85% pazopanib, 77% sunitinib). A higher
percentage of patients with non-clear cell (papillary, chromophobe,
or translocation) and unclassified RCC received
treatment with sunitinib. Histology detail was not
available in less than 10% of both cohorts (Table 2).
Treatment and subsequent therapy
Only 52% and 59% of patients in the sunitinib and pazopanib
groups started treatment at full dose. Median duration
on treatment was 6.5 and 6.2 months for sunitinib
and pazopanib group, respectively. Forty-two percent
(42%) of patients who discontinued first line sunitinib or
pazopanib received second line treatment. Subsequent
treatments were predominantly axitinib (P 51%, S 40%)
and everolimus (P 35%, S 38%) while very small number
(less than 5%) of patients received other treatment such
as nivolumab, HD IL-2 or treatment within clinical trial
during this period. Proportionately more patients in the
pazopanib group were able to receive any subsequent
treatment (58%) compared to sunitinib group (42%).
Response rate
Overall Response Rate (ORR) was 22% of which 2% were
complete; 43% of patients had SD as best response while
over a quarter had PD. ORR was 25% and 21% in Sunitinib
and pazopanib arm respectively.
110 Kidney Cancer Journal
Survival
Median follow up was to 40.2 months. One year survival
estimated to be above 60%. Median PFS and OS of the entire
cohort are 10.5 and 15.8 months respectively (see
Tables 3,4).
Median PFS of pazopanib cohort (8.3 months) was
lower than Sunitinib (10.4 months P = 0.02) but median
OS was not significantly different (S 17.7 v P 14.8 months
P = 0.67). Figure 1 and 2 respectively. No statistically significant
difference in PFS or OS was detected among patients
with matched prognostic risk receiving the
different drug type on univariate analysis (Figures 3, 4).
Median OS of patient with Favorable risk was 47.3
months (36 months and 47 months in the sunitinib and
pazopanib groups, respectively, P = 0.18). This was significantly
lower at 20.8 months and 7.4 months for intermediate
and poor-risk groups, respectively. See Table 3
and 4 for PFS and OS OF different risk groups.
Discussion
The median OS in our study population is notably lower
compared to contemporary trial or real-world reports of
similar treatment setting (16 versus 23-28 months). Of
significance, only about 7% of patients in our study population
had favorable IMDC risk category which is in
stark contrast to at least 25-27% in COMPARZ or IMDC