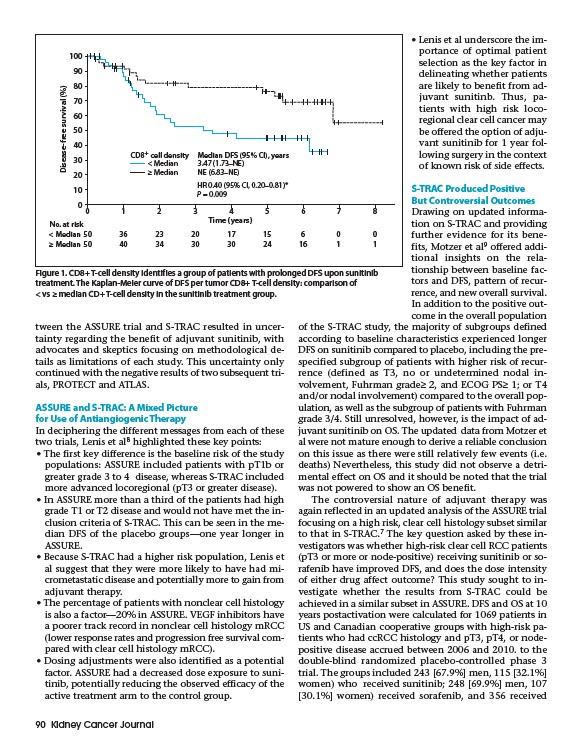
CD8+ cell density Median DFS (95% CI), years
< Median
≥ Median
3.47 (1.73–NE)
NE (6.83–NE)
HR 0.40 (95% CI, 0.20–0.81)*
P = 0.009
tween the ASSURE trial and S-TRAC resulted in uncertainty
regarding the benefit of adjuvant sunitinib, with
advocates and skeptics focusing on methodological details
as limitations of each study. This uncertainty only
continued with the negative results of two subsequent trials,
PROTECT and ATLAS.
ASSURE and S-TRAC: A Mixed Picture
for Use of Antiangiogenic Therapy
In deciphering the different messages from each of these
two trials, Lenis et al8 highlighted these key points:
• The first key difference is the baseline risk of the study
populations: ASSURE included patients with pT1b or
greater grade 3 to 4 disease, whereas S-TRAC included
more advanced locoregional (pT3 or greater disease).
• In ASSURE more than a third of the patients had high
grade T1 or T2 disease and would not have met the inclusion
criteria of S-TRAC. This can be seen in the median
DFS of the placebo groups—one year longer in
ASSURE.
• Because S-TRAC had a higher risk population, Lenis et
al suggest that they were more likely to have had micrometastatic
disease and potentially more to gain from
adjuvant therapy.
• The percentage of patients with nonclear cell histology
is also a factor—20% in ASSURE. VEGF inhibitors have
a poorer track record in nonclear cell histology mRCC
(lower response rates and progression free survival compared
with clear cell histology mRCC).
• Dosing adjustments were also identified as a potential
factor. ASSURE had a decreased dose exposure to sunitinib,
potentially reducing the observed efficacy of the
active treatment arm to the control group.
90 Kidney Cancer Journal
• Lenis et al underscore the importance
of optimal patient
selection as the key factor in
delineating whether patients
are likely to benefit from adjuvant
sunitinb. Thus, patients
with high risk locoregional
clear cell cancer may
be offered the option of adjuvant
sunitinib for 1 year following
surgery in the context
of known risk of side effects.
S-TRAC Produced Positive
But Controversial Outcomes
Drawing on updated information
on S-TRAC and providing
further evidence for its benefits,
Motzer et al9 offered additional
insights on the relationship
between baseline factors
and DFS, pattern of recurrence,
and new overall survival.
In addition to the positive outcome
in the overall population
of the S-TRAC study, the majority of subgroups defined
according to baseline characteristics experienced longer
DFS on sunitinib compared to placebo, including the prespecified
subgroup of patients with higher risk of recurrence
(defined as T3, no or undetermined nodal involvement,
Fuhrman grade≥ 2, and ECOG PS≥ 1; or T4
and/or nodal involvement) compared to the overall population,
as well as the subgroup of patients with Fuhrman
grade 3/4. Still unresolved, however, is the impact of adjuvant
sunitinib on OS. The updated data from Motzer et
al were not mature enough to derive a reliable conclusion
on this issue as there were still relatively few events (i.e.
deaths) Nevertheless, this study did not observe a detrimental
effect on OS and it should be noted that the trial
was not powered to show an OS benefit.
The controversial nature of adjuvant therapy was
again reflected in an updated analysis of the ASSURE trial
focusing on a high risk, clear cell histology subset similar
to that in S-TRAC.7 The key question asked by these investigators
was whether high-risk clear cell RCC patients
(pT3 or more or node-positive) receiving sunitinib or sorafenib
have improved DFS, and does the dose intensity
of either drug affect outcome? This study sought to investigate
whether the results from S-TRAC could be
achieved in a similar subset in ASSURE. DFS and OS at 10
years postactivation were calculated for 1069 patients in
US and Canadian cooperative groups with high-risk patients
who had ccRCC histology and pT3, pT4, or nodepositive
disease accrued between 2006 and 2010. to the
double-blind randomized placebo-controlled phase 3
trial. The groups included 243 67.9% men, 115 32.1%
women) who received sunitinib; 248 69.9% men, 107
30.1% women) received sorafenib, and 356 received
100
90
80
70
60
50
40
30
20
10
0
0 1 2 3 4 5 6 7 8
Time (years)
Disease-free survival (%)
No. at risk
< Median 50 36 23 20 17 15 6 0 0
≥ Median 50 40 34 30 30 24 16 1 1
Figure 1. CD8+ T-cell density identifies a group of patients with prolonged DFS upon sunitinib
treatment. The Kaplan-Meier curve of DFS per tumor CD8+ T-cell density: comparison of
< vs ≥ median CD+ T-cell density in the sunitinib treatment group.