Kidney Cancer Journal 57
MEDICAL INTELLIGENCE
(continued from page 33)
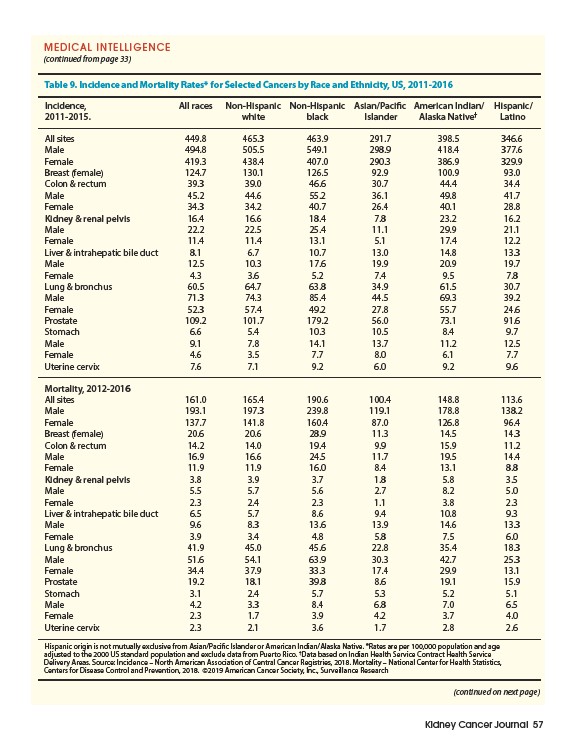
Table 9. Incidence and Mortality Rates* for Selected Cancers by Race and Ethnicity, US, 2011-2016
Incidence, All races Non-Hispanic Non-Hispanic Asian/Pacific American Indian/ Hispanic/
2011-2015. white black Islander Alaska Native† Latino
All sites 449.8 465.3 463.9 291.7 398.5 346.6
Male 494.8 505.5 549.1 298.9 418.4 377.6
Female 419.3 438.4 407.0 290.3 386.9 329.9
Breast (female) 124.7 130.1 126.5 92.9 100.9 93.0
Colon & rectum 39.3 39.0 46.6 30.7 44.4 34.4
Male 45.2 44.6 55.2 36.1 49.8 41.7
Female 34.3 34.2 40.7 26.4 40.1 28.8
Kidney & renal pelvis 16.4 16.6 18.4 7.8 23.2 16.2
Male 22.2 22.5 25.4 11.1 29.9 21.1
Female 11.4 11.4 13.1 5.1 17.4 12.2
Liver & intrahepatic bile duct 8.1 6.7 10.7 13.0 14.8 13.3
Male 12.5 10.3 17.6 19.9 20.9 19.7
Female 4.3 3.6 5.2 7.4 9.5 7.8
Lung & bronchus 60.5 64.7 63.8 34.9 61.5 30.7
Male 71.3 74.3 85.4 44.5 69.3 39.2
Female 52.3 57.4 49.2 27.8 55.7 24.6
Prostate 109.2 101.7 179.2 56.0 73.1 91.6
Stomach 6.6 5.4 10.3 10.5 8.4 9.7
Male 9.1 7.8 14.1 13.7 11.2 12.5
Female 4.6 3.5 7.7 8.0 6.1 7.7
Uterine cervix 7.6 7.1 9.2 6.0 9.2 9.6
Mortality, 2012-2016
All sites 161.0 165.4 190.6 100.4 148.8 113.6
Male 193.1 197.3 239.8 119.1 178.8 138.2
Female 137.7 141.8 160.4 87.0 126.8 96.4
Breast (female) 20.6 20.6 28.9 11.3 14.5 14.3
Colon & rectum 14.2 14.0 19.4 9.9 15.9 11.2
Male 16.9 16.6 24.5 11.7 19.5 14.4
Female 11.9 11.9 16.0 8.4 13.1 8.8
Kidney & renal pelvis 3.8 3.9 3.7 1.8 5.8 3.5
Male 5.5 5.7 5.6 2.7 8.2 5.0
Female 2.3 2.4 2.3 1.1 3.8 2.3
Liver & intrahepatic bile duct 6.5 5.7 8.6 9.4 10.8 9.3
Male 9.6 8.3 13.6 13.9 14.6 13.3
Female 3.9 3.4 4.8 5.8 7.5 6.0
Lung & bronchus 41.9 45.0 45.6 22.8 35.4 18.3
Male 51.6 54.1 63.9 30.3 42.7 25.3
Female 34.4 37.9 33.3 17.4 29.9 13.1
Prostate 19.2 18.1 39.8 8.6 19.1 15.9
Stomach 3.1 2.4 5.7 5.3 5.2 5.1
Male 4.2 3.3 8.4 6.8 7.0 6.5
Female 2.3 1.7 3.9 4.2 3.7 4.0
Uterine cervix 2.3 2.1 3.6 1.7 2.8 2.6
Hispanic origin is not mutually exclusive from Asian/Pacific Islander or American Indian/Alaska Native. *Rates are per 100,000 population and age
adjusted to the 2000 US standard population and exclude data from Puerto Rico. †Data based on Indian Health Service Contract Health Service
Delivery Areas. Source: Incidence – North American Association of Central Cancer Registries, 2018. Mortality – National Center for Health Statistics,
Centers for Disease Control and Prevention, 2018. ©2019 American Cancer Society, Inc., Surveillance Research
(continued on next page)