compared with normal tissue or earlier stage tumors,
ctDNA constitutes a larger proportion of cfDNA in
metastatic disease.16,17 Patients with high tumor burdens
and aggressive disease have higher proportions of ctDNA,
which may rise above 90% of cfDNA.18 The presence of
multiple alterations in ctDNA may also represent selective
treatment pressures and/or tumor heterogeneity,
though, which complicate interpretation of identified
variants. Ultimately, the goal of ctDNA is to derive actionable
genomic information from a peripheral source
to make real-time, personalized cancer treatment decisions.
19
Investigational Uses of cfDNA and ctDNA:
Potential Implications
Although the clinical utility of these assays is not ready
for “prime time”, especially since integral biomarkers are
not currently used to guide targeted therapy or immunotherapy
in mRCC, a review of recent literature offers
a glimpse of how these techniques can be applied as
they move forward from the bench to the bedside. In a
study by Wan et al.,20 for example, results demonstrate
how cfDNA may play a potential role in monitoring patients
with RCC after nephrectomy. The objective of this
and other such studies is to extend to RCC the significance
of plasma/serum cfDNA identified post-surgically
as studied in other solid tumors. Wan and colleagues focused
on whether a quantitative analysis—before and
after nephrectomy—could play an important role in
monitoring patients during follow-up for detection of a
recurrence in clear cell RCC (ccRCC). The pretreatment
level of plasma cfDNA in patients with metastatic ccRCC
(6.04 ± 0.72) was significantly higher than those with localized
ccRCC (5.29 ± 0.53, p=0.017) or controls (0.65 ±
0.29, p < 0.001). Of patients with localized ccRCC, those
with disease recurrence had a significantly higher plasma
26 Kidney Cancer Journal
cfDNA level than those without (p=0.024). Further, patients
with a high plasma cfDNA level had a significantly
higher recurrence rate than those with a low plasma
cfDNA level before and after nephrectomy (p= 0.018).
Although the follow-up was relatively short (36
months), the results from Wan et al. highlight potentially
a “minimal residual disease” state which would be
helpful in monitoring ccRCC patients after surgery. Traditional
nomograms which currently help predict recurrence
include variables like disease stage, high Fuhrman
grade or large tumor size, and adding serum testing after
surgery to characterize this biological disease state may
add predictive power. Several observations suggest the
potential value of cfDNA in this setting: there was a significant
difference of plasma cfDNA levels between low
and high Fuhrman grade; patients with high disease
stage (T3) and large tumor size (>3 cm) had significantly
higher plasma cfDNA levels than those with lower stage
and smaller tumors. Also, the average cfDNA level was
significantly higher in metastatic tumors (N+ and/or M+)
than in localized tumors before nephrectomy.
One of the challenges with ctDNA studies in RCC has
been uncovered in large pan-cancer studies, which show
a relatively low recovered ctDNA quantity in patients
with kidney cancers when compared to other solid tumors.
In an analysis of 21,807 patients with treated, latestage
cancers across more than 50 cancer types, the
recovered ctDNA for renal cancer is much less robust
(Figure 1).10 Understanding why ctDNA loads remain
low for this cancer may help fuel new RCC-specific
methods to improve ctDNA detection. Nevertheless, several
recent reports are capturing the narrative of how
ctDNA can be used for clinical care.
One report by Hahn and colleagues21 assessed whe-
Colorectal
SCLC
Bladder
Liver
Prostate
Gastric
NSCLC
Melanoma
Ovarian
Pancreas
Renal
Glioma*
Breast
50.00
20.00
10.00
5.00
2.00
1.00
0.50
0.20
0.10
0.05
ctDNA Level (%)
Fig. 1. In an analysis of 21,807 patients with treated, late-stage
cancers across more than 50 cancer types, the recovered ctDNA
for renal cancer is much less robust. (Adapted from reference 19.)
15
10
5
0
SLD (cm)
ctDNA Not Detected
ctDNA Detected
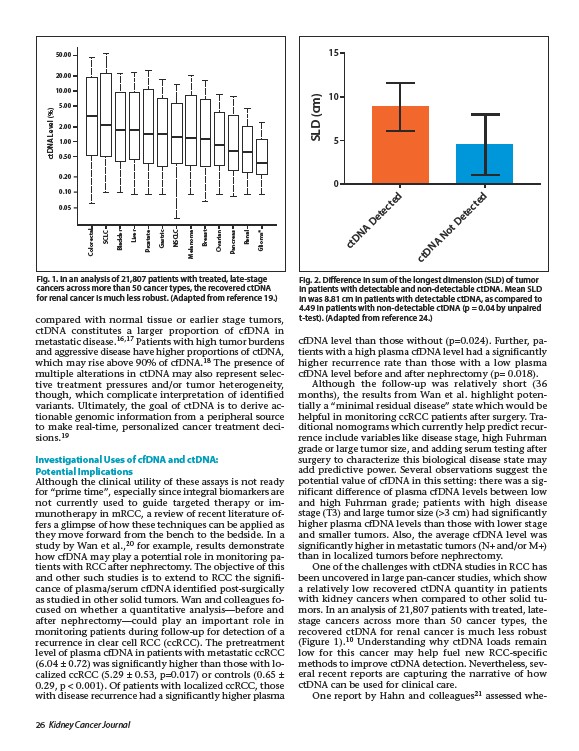
Fig. 2. Difference in sum of the longest dimension (SLD) of tumor
in patients with detectable and non-detectable ctDNA. Mean SLD
in was 8.81 cm in patients with detectable ctDNA, as compared to
4.49 in patients with non-detectable ctDNA (p = 0.04 by unpaired
t-test). (Adapted from reference 24.)