Kidney Cancer Journal 27
ther genomic alterations detected by ctDNA NGS are
truly representative of those alterations detected in
tumor tissues. Are these NGS platforms interchangeable
or complementary? Understanding this key distinction
impacts how and when to integrate ctDNA testing during
clinical care. In this first report to correlate ctDNA
with matched tumor tissue NGS, there is mixed news.
When the study controlled for genes tested by both platforms,
the median mutation rate for ctDNA was similar
to tissue (median 3.0 vs 1.0) but the concordance rate
between the two platforms was only 8.6%. This result is
comparable to findings in other solid tumors on concordance.
The “take-home” message from this study is that
ctDNA NGS offers the advantage of a decreased risk for
sample collection and an improved ease of repetitive
testing over tumor tissue NGS, and that these two platforms
may be used in concert with each other rather
than as a substitute. Since this avenue of investigation is
still in the preliminary stage, appropriate use of ctDNA
in this context remains an area of active research.
CtDNA and Checkpoint Inhibitor Therapy
A key question in this era of precision medicine is to
what extent ctDNA might be applied to correlate with
response to immune checkpoint inhibitors. Recently,
Khagi et al.22 studied whether hypermutated ctDNA correlated
with immune checkpoint inhibitor response in
solid tumors. In this study of 69 patients with various
malignancies including melanoma, lung cancer, and
head and neck cancer, 63 patients (91% of the cohort)
had at least one ctDNA alteration detected. Characterizing
these alterations further, the authors found many patients
with “variants of unknown significance (VUS)”,
which refers to a variant identified through genetic testing
whose significance on disease
remains unknown. The
authors found an association
between ctDNA VUS on pro-
gression-free survival (PFS) and
overall survival (OS) with immune
checkpoint blockade
therapy. For example, at two
months, landmark survival
analyses of responder’s versus
non-responders to checkpoint
inhibitor therapy with VUS >3
showed a median PFS of 23
versus 2.3 months (p=0.004).
The preliminary conclusions
from this study – still investigational
- is that tissue tumor
mutational burden as determined
by liquid biopsy could
also have a role in predicting
response to immunotherapy.
A closely related case report
by Dizman et al.23 of ctDNA
changes in a patient with
metastatic RCC who achieved
an exceptional response to
nivolumab therapy adds personalized
context to the clinical
utility of ctDNA in metastatic RCC. In this case, the
patient’s disease had progressed after treatment with bevacizumab
and subsequently cabozantinib. In addition
to several genomic alterations from a tissue-based assessment,
unique alterations were noted in ctDNA at baseline.
After 4 weeks of therapy with nivolumab, the
patient had a significant clinical response to immune
checkpoint blockade therapy. Interval ctDNA analysis during
nivolumab therapy showed no alterations, highlighting
paralleled changes in ctDNA with therapy response.
An additional metric highlighted from this case
report is whether the rate of ctDNA change, termed
ctDNA velocity, may be used as a surrogate for therapy
response. In this case report, 6 distinct genomic alterations
were identified. Although this is not a clear surrogate
for mutational burden, Dizman et al.23 refer to other
reports that link the presence of increased mutational
load with response to checkpoint inhibition. Additionally,
timing of ctDNA changes seen during therapy may
represent markers for cell turnover and therefore surrogates
of treatment response. As prior research has
demonstrated differences in radiographic tumor burden
with ctDNA (Figure 2),24 dynamic measurements which
incorporate serial changes in ctDNA like velocity could
have significant implications particularly in challenging
scenarios like pseudoprogression.
Single-Time Point and Evolutionary Changes in ctDNA
A new generation of studies extending the above efforts
into large cohorts of treated RCC patients provides additional
insights into the utility of ctDNA as a tool which
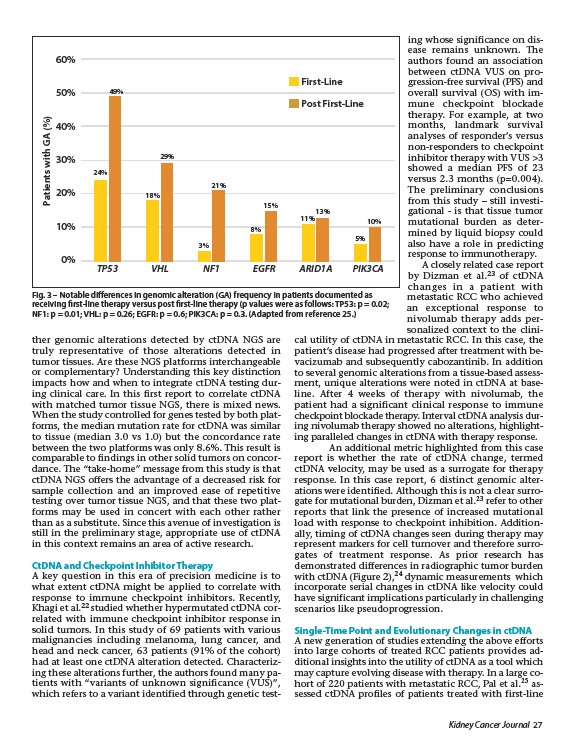
may capture evolving disease with therapy. In a large cohort
of 220 patients with metastatic RCC, Pal et al.25 assessed
ctDNA profiles of patients treated with first-line
60%
50%
40%
30%
20%
10%
0%
Patients with GA (%)
First-Line
Post First-Line
24%
49%
18%
29%
21%
8%
15%
11%
13%
5%
10%
3%
TP53 VHL NF1 EGFR ARID1A PIK3CA
Fig. 3 – Notable differences in genomic alteration (GA) frequency in patients documented as
receiving first-line therapy versus post first-line therapy (p values were as follows: TP53: p = 0.02;
NF1: p = 0.01; VHL: p = 0.26; EGFR: p = 0.6; PIK3CA: p = 0.3. (Adapted from reference 25.)