Mass Growth In Interconnects
Considering the projected connected infrastructure market growth of 9 percent, annual network bandwidth growth
rate of 50 percent, and the push toward cloud and hyperscale network topologies where data center growth is being
moved to separate and remote edge facilities, physical interconnects are experiencing hyper growth.
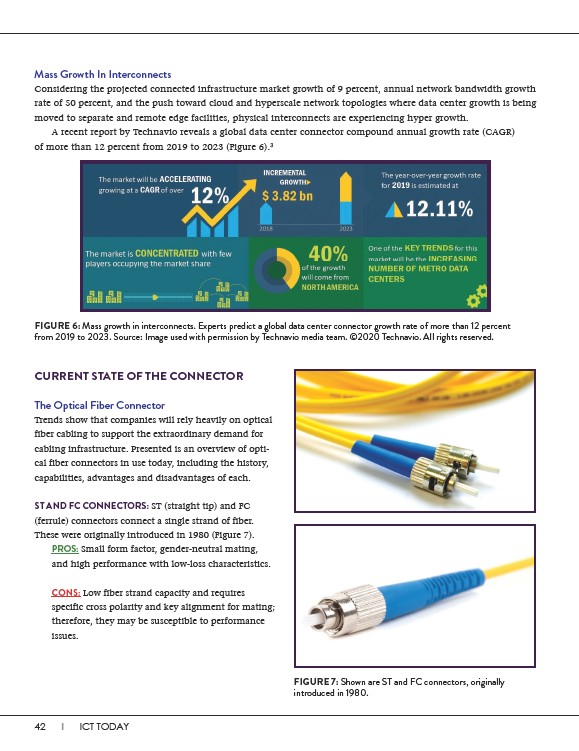
A recent report by Technavio reveals a global data center connector compound annual growth rate (CAGR)
of more than 12 percent from 2019 to 2023 (Figure 6).3
FIGURE 6: Mass growth in interconnects. Experts predict a global data center connector growth rate of more than 12 percent
from 2019 to 2023. Source: Image used with permission by Technavio media team. ©2020 Technavio. All rights reserved.
CURRENT STATE OF THE CONNECTOR
The Optical Fiber Connector
Trends show that companies will rely heavily on optical
fiber cabling to support the extraordinary demand for
cabling infrastructure. Presented is an overview of optical
fiber connectors in use today, including the history,
capabilities, advantages and disadvantages of each.
42 I ICT TODAY
FIGURE 7: Shown are ST and FC connectors, originally
introduced in 1980.
ST AND FC CONNECTORS: ST (straight tip) and FC
(ferrule) connectors connect a single strand of fiber.
These were originally introduced in 1980 (Figure 7).
PROS: Small form factor, gender-neutral mating,
and high performance with low-loss characteristics.
CONS: Low fiber strand capacity and requires
specific cross polarity and key alignment for mating;
therefore, they may be susceptible to performance
issues.