54 I ICT TODAY
500%
450%
400%
350%
300%
250%
200%
150%
100%
0%
24 Port 48 Port 72 Port
50%
One-Segment Two-Segment Three-Segment
Relative Cost of MPO based
Structured Cabling
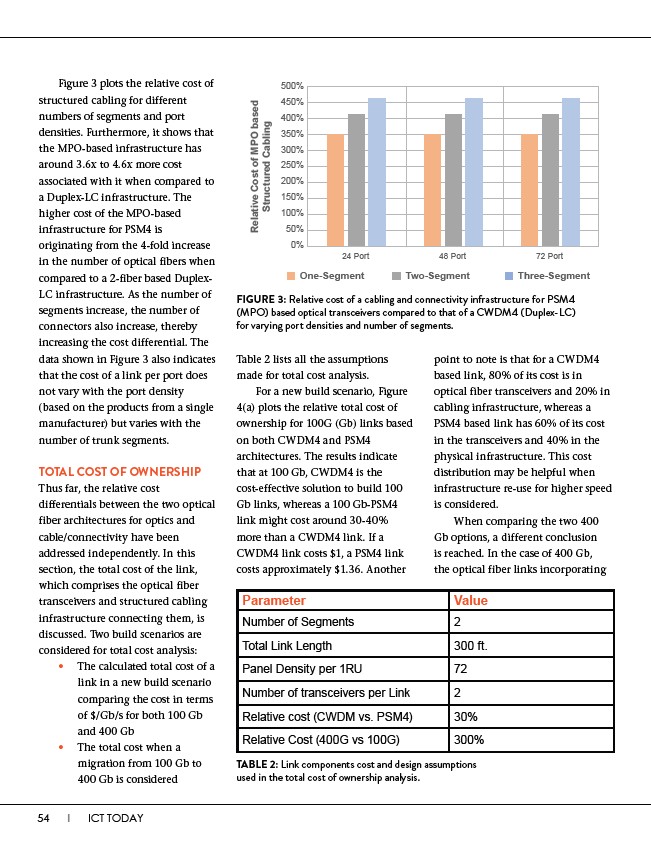
FIGURE 3: Relative cost of a cabling and connectivity infrastructure for PSM4
(MPO) based optical transceivers compared to that of a CWDM4 (Duplex-LC)
for varying port densities and number of segments.
Parameter Value
Number of Segments 2
Total Link Length 300 ft.
Panel Density per 1RU 72
Number of transceivers per Link 2
Relative cost (CWDM vs. PSM4) 30%
Relative Cost (400G vs 100G) 300%
TABLE 2: Link components cost and design assumptions
used in the total cost of ownership analysis.
Figure 3 plots the relative cost of
structured cabling for different
numbers of segments and port
densities. Furthermore, it shows that
the MPO-based infrastructure has
around 3.6x to 4.6x more cost
associated with it when compared to
a Duplex-LC infrastructure. The
higher cost of the MPO-based
infrastructure for PSM4 is
originating from the 4-fold increase
in the number of optical fibers when
compared to a 2-fiber based Duplex-
LC infrastructure. As the number of
segments increase, the number of
connectors also increase, thereby
increasing the cost differential. The
data shown in Figure 3 also indicates
that the cost of a link per port does
not vary with the port density
(based on the products from a single
manufacturer) but varies with the
number of trunk segments.
TOTAL COST OF OWNERSHIP
Thus far, the relative cost
differentials between the two optical
fiber architectures for optics and
cable/connectivity have been
addressed independently. In this
section, the total cost of the link,
which comprises the optical fiber
transceivers and structured cabling
infrastructure connecting them, is
discussed. Two build scenarios are
considered for total cost analysis:
• The calculated total cost of a
link in a new build scenario
comparing the cost in terms
of $/Gb/s for both 100 Gb
and 400 Gb
• The total cost when a
migration from 100 Gb to
400 Gb is considered
Table 2 lists all the assumptions
made for total cost analysis.
For a new build scenario, Figure
4(a) plots the relative total cost of
ownership for 100G (Gb) links based
on both CWDM4 and PSM4
architectures. The results indicate
that at 100 Gb, CWDM4 is the
cost-effective solution to build 100
Gb links, whereas a 100 Gb-PSM4
link might cost around 30-40%
more than a CWDM4 link. If a
CWDM4 link costs $1, a PSM4 link
costs approximately $1.36. Another
point to note is that for a CWDM4
based link, 80% of its cost is in
optical fiber transceivers and 20% in
cabling infrastructure, whereas a
PSM4 based link has 60% of its cost
in the transceivers and 40% in the
physical infrastructure. This cost
distribution may be helpful when
infrastructure re-use for higher speed
is considered.
When comparing the two 400
Gb options, a different conclusion
is reached. In the case of 400 Gb,
the optical fiber links incorporating