chart area. The content of this menu is context
sensitive. The reason for the “Focused
Context Menus” is to keep the number of
options down to a reasonable level, and still
be able to deal with all situations. There are
basic right click menus when clicking at a
random point, and focused menus when
clicking on a waypoint, a route, a track, or
an AIS target. If you have just created or
deleted a waypoint, or if chart groups are
defined, there are further entries added to
the basic menu. Explanations of the basic
entries follow.
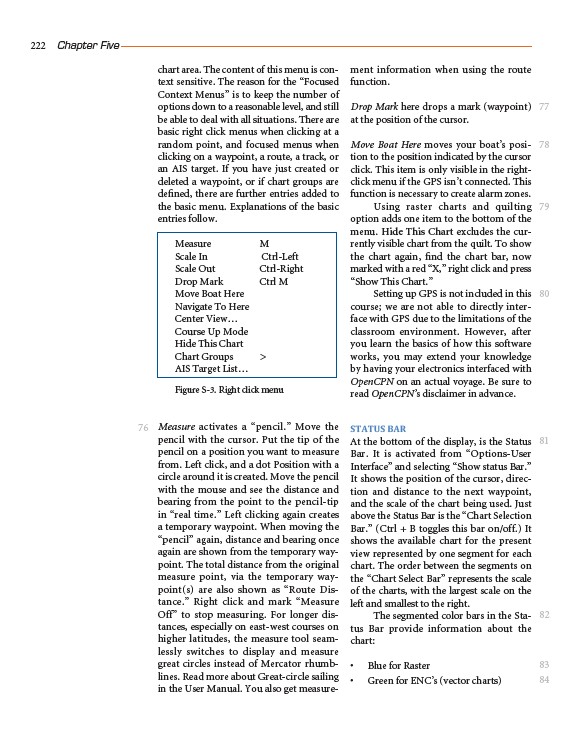
Measure M
Scale In Ctrl-Left
Scale Out Ctrl-Right
Drop Mark Ctrl M
Move Boat Here
Navigate To Here
Center View…
Course Up Mode
Hide This Chart
Chart Groups >
AIS Target List…
Figure S-3. Right click menu
Measure activates a “pencil.” Move the
pencil with the cursor. Put the tip of the
pencil on a position you want to measure
from. Left click, and a dot Position with a
circle around it is created. Move the pencil
with the mouse and see the distance and
bearing from the point to the pencil-tip
in “real time.” Left clicking again creates
a temporary waypoint. When moving the
“pencil” again, distance and bearing once
again are shown from the temporary waypoint.
The total distance from the original
measure point, via the temporary waypoint(
s) are also shown as “Route Distance.”
Right click and mark “Measure
Off” to stop measuring. For longer distances,
especially on east-west courses on
higher latitudes, the measure tool seamlessly
switches to display and measure
great circles instead of Mercator rhumblines.
Read more about Great-circle sailing
in the User Manual. You also get measurement
information when using the route
function.
Drop Mark here drops a mark (waypoint)
at the position of the cursor.
Move Boat Here moves your boat’s position
to the position indicated by the cursor
click. This item is only visible in the rightclick
menu if the GPS isn’t connected. This
function is necessary to create alarm zones.
Using raster charts and quilting
option adds one item to the bottom of the
menu. Hide This Chart excludes the currently
visible chart from the quilt. To show
the chart again, find the chart bar, now
marked with a red “X,” right click and press
“Show This Chart.”
Setting up GPS is not included in this
course; we are not able to directly interface
with GPS due to the limitations of the
classroom environment. However, after
you learn the basics of how this software
works, you may extend your knowledge
by having your electronics interfaced with
OpenCPN on an actual voyage. Be sure to
read OpenCPN’s disclaimer in advance.
STATUS BAR
At the bottom of the display, is the Status
Bar. It is activated from “Options-User
Interface” and selecting “Show status Bar.”
It shows the position of the cursor, direction
and distance to the next waypoint,
and the scale of the chart being used. Just
above the Status Bar is the “Chart Selection
Bar.” (Ctrl + B toggles this bar on/off.) It
shows the available chart for the present
view represented by one segment for each
chart. The order between the segments on
the “Chart Select Bar” represents the scale
of the charts, with the largest scale on the
left and smallest to the right.
The segmented color bars in the Status
Bar provide information about the
chart:
• Blue for Raster
• Green for ENC’s (vector charts)
222 Chapter Five
76
77
78
79
80
81
82
83
84